Debugging with Node.js and debug
One of the things I find most useful when creating complex Node.js applications is easily seeing what component of the code is generating console output.
Now, it’d be pretty easy for me to simply bash in a command such as this:
console.log(arguments).
But there are a couple of problems here:
- The log is output as a nondescript white line of text. If there’s a few of these in an application that processes it’s data in a matter of milliseconds, it’s easy for them to get lost
- The log output from my User Model is no different from the log out from my Socket Component. If you have similar debug traces it soon becomes a bit of a confusing affair.
- The time between these logs is impossible to tell.. Did it take two seconds? Did it take 5 minutes?
These problems and probably more can be solved using one pretty simple NPM Plugin - Debug.
Install with the following command:
npm install debug
(add --save if you want the package to be included as a dependency for your project, or --save-dev for if you want it to be a dependency while you’re debugging)
This allows you to write the following line at the top of your file, and make calls like:
// Debugging
var debug = require('debug')('components:notify');

// Debug this object
debug({state: notifyComponent.state});
What’s going on?
First off, I create a reference to the plugin in the standard Node-y way of require('debug'). Then, as an argument to the plugin I pass the string components:notify, which provides a “category” for any debug output sent into the function.
I could also do this:
// Debug user model
var userDebug = require('debug')('components:user'),
      feedDebug = require('debug')('components:feed');

// Debug this object
userDebug("Loaded component");
feedDebug("Loaded component");
Getting to the point
However, right now when you run the program, nothing from the debug will be output. This is by design, because this brings me on to the next useful thing about debug. You can and should specify what debug categories to listen out for.
To do this, I execute the following call in my Terminal:
$ DEBUG=components:* nodemon ./bin/my-app
This sets an environment variable called DEBUG which contains a list of what categories to look out for. The * character says “look for any item that begins with components:, sort of like a wildcard.
I could also do this:
$ DEBUG=components:user, components:feed nodemon ./bin/my-app
Which would do exactly the same.
How does it look?
This yields output similar to this when it’s run. Ignore the other output, this is from a live app I’m developing!
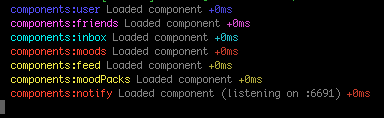
Notice also the +0ms at the end of the debug output. This tells you how long its been since debug was last called. I find this really useful for identifying functions that are taking a long time to finis.
I hope you find that useful, more to come :)